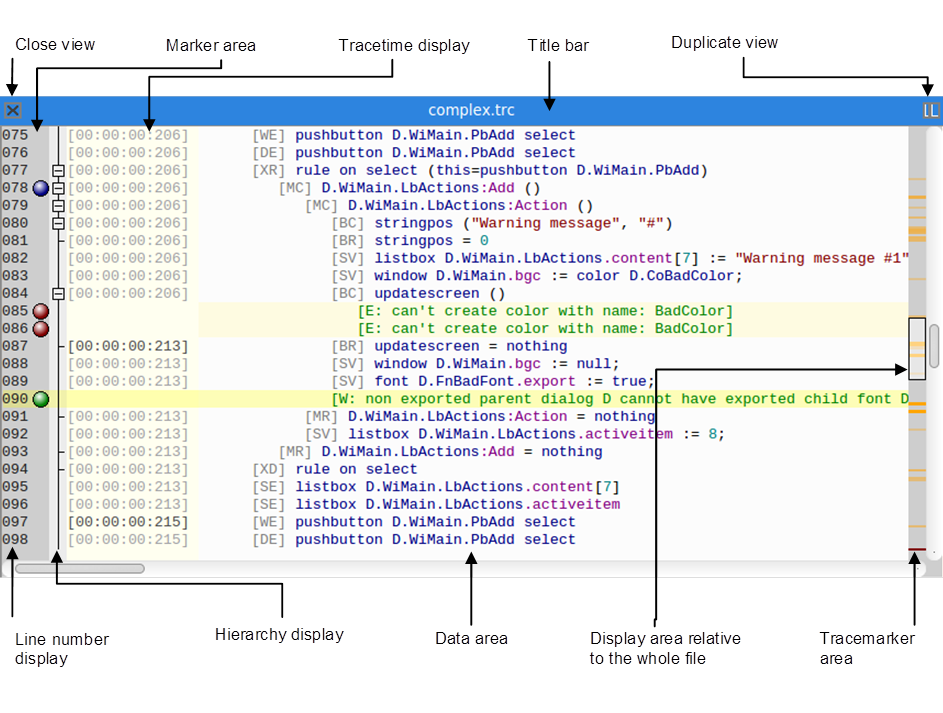
2.2 Trace View
A trace view is divided into different subareas that all display specific context-related information or allow actions.
The actual content of a trace file is presented in the data area.
The selected and thus active line is highlighted in bright yellow through to the line number.
The indentation width is controlled by the Tracefile Analyzer setting Indent Size (menu ). The default indentation width is set to 3.
2.2.1 Colored Highlightings and Markings
For easier recognition and distinction of certain keywords, the contents of the trace file are highlighted with colors in the data area. The coloring is based, among other things, on the values and several IDM keywords. Also, trace codes, tracetime as well as IDM errors and IDM messages are highlighted specially.
|
Text Color |
Meaning |
|---|---|
|
|
Tracetime |
|
|
Trace |
|
Cyan |
|
|
|
|
|
|
String |
|
|
Paths, keywords: events, built-ins, data types, classes, functions… |
|
Magenta |
Attribute or rule |
|
|
Pointer |
|
|
|
|
|
Trace code with time leap (tracetime area) or undefined, cannot be associated (data area). |
For a quick identification of problem areas, the lines of IDM error messages (error, ASSFAIL, dumpstate) are additionally shaded light red and those of IDM messages ([I:, [W:, [E:, [F:) are shaded yellow. These spots are also indicated in the tracemarker area ( see Kapitel „Tracemarker Area“ for more information).
If filters are active, each line is shaded with a corresponding filter color, showing which lines match the same filter criteria.
If a user wants to select something, a double click on the respective term will suffice. The selection is shaded dark blue. Please note that IDM keywords (e.g. :method, .attribute, DM function), object paths or values are always marked completely. With string values, for example, the complete string is selected and not just one word.
2.2.2 Line Number Display
The line number display is always active by default and provides information about the position within the trace file, which plays a particular role in a filtered view. The display of line numbers can be toggled on and off via the menu.
When loading the end of a file, the line numbering starts with 1 at the first loaded line.
2.2.3 Marker Area
The user can mark and memorize interesting spots with markers in the marker area. A single mouse click at the relevant line within the marker area sets the default marker. Another click removes the marker.
Furthermore, markers for the currently selected line may also be set via the menu or corresponding keyboard shortcuts. Besides the default marker (blue), there are three more marker types available –marker 1 (red), marker 2 (yellow) and marker 3 (green) – which can be applied via the menu or the corresponding keyboard shortcut.
Only one marker can be set per line. If a marker of a different type is set over an existing marker, the old marker will be replaced by the new one. If a marker of the same type is set over an existing marker, the marker will be removed.
2.2.4 Hierarchy Display
The hierarchy display illustrates the tree structure of the trace file. Through the symbols of the hierarchy display, it is possible to influence the presentation and displayed structure of the trace file. In this way, areas of uninteresting trace codes can be hidden or areas of interest can be included again.
|
Symbol |
Meaning |
|---|---|
|
|
This line represents the start of an expanded trace code node at the top hierarchy level. The next line has a new hierarchy level. A mouse-click collapses the code area. The symbol of this line will change to |
|
|
This line represents the start of an expanded trace code node inside another trace code node. The next line has a new hierarchy level. A mouse-click collapses the code area. The symbol of this line will change to |
|
|
This line is located within a trace code node on the same hierarchy level. |
|
|
This line indicates the end of a trace code node at the top hierarchy level and always belongs to the first |
|
|
This line indicates the end of a trace code node which is inside another trace code node and always belongs to the first |
|
|
This line is at the top hierarchy level and is not part of a trace code node. |
|
|
This line represents a collapsed trace code node at the top hierarchy level. In the data area, this is additionally marked with the symbol A mouse-click expands the trace code node again. The symbol of this line will change to |
|
|
This line represents a collapsed trace code node inside another trace code node. In the data area, this is additionally marked with the symbol A mouse-click expands the trace code node again. The symbol of this line will change to |
|
|
This line indicates a broken trace code node. This means, no end node can be found that would be associated with this node. Therefore, all subsequent lines are not displayed as being within this trace code node. |

 .
.
 .
.


 at the end of the line.
The hierarchy display is empty in filter mode, since the structure information would be out of context in filtered state.
2.2.5 Tracetime Display
Trace files generated with the -IDMtracetime option will show the timestamps by default. The time information always stays in the field of vision, even if the data content is scrolled to the right. So the temporal context will be preserved.
Time leaps, which might be relevant for evaluation, are emphasized even stronger. This allows, for instance, to identify time-consuming routines.
Optional kann die Tracetime-Anzeige über das Menü oder die Taste F7 aus- und wieder eingeschaltet werden. Diese Einstellung ist global, d.h. sie gilt für alle geöffneten Ansichten.
Optionally, the tracetime display can be switched off and on again through the menu or the key F7. This is a global setting, i.e. it applies to all open views.
2.2.6 Tracemarker Area
The tracemarker area is located at the right-hand side of the data area. This area shows which section of the entire trace file is currently displayed in the field of vision. Moreover, all parts of the trace file that contain IDM messages and IDM error messages are highlighted in yellow or red. This provides a quick overview of the error and problem areas of the whole trace file.
A double-click with the mouse in the tracemarker area allows to jump directly to the respective area in the trace file. This way it is possible to quickly browse through the individual problem areas and move back and forth between them.