2.3 Damaged Trace Files
When importing a trace file, the Tracefile Analyzer tries to determine its entire structure with regard to hierarchy, nodes and indentation. However, this is not always fully possible, for example, if a trace file is faulty or incomplete.
Corrupt or incomplete nodes are recognized and indicated in the hierarchy display by the symbol  . Since it is impossible to associate an end node with such nodes, the following lines inevitably cannot be associated with this node. This may also affect the navigation within the trace file. One should therefore be careful here and if necessary evaluate the allocation oneself.
2.4 Loading Very Large Trace Files
When you open a trace file that is too large to be loaded completely with the Tracefile Analyzer, the dialog box Load Options is shown in which you can decide how to proceed.
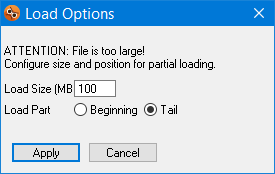
The value in the input field Load Size specifies how much of the trace file should be loaded.
The radiobuttons Beginning and Tail determine, which part of the trace file is loaded.
With Apply the specified part of the trace file is loaded.
Cancel aborts loading the trace file.
If a file is loaded only partially, information about the loaded subrange is displayed in the Map Range row of the Info Area.
When loading the end of a file, the loaded part may begin somewhere in the middle of a trace line and the line numbering starts with 1 at the first loaded line.
Note
The Tracefile Analyzer supports loading files larger than 2 GB on 32- and 64-bit systems. However, the size up to which a file can actually be loaded depends on several factors, such as the addressable or allocatable memory, the number of lines, and others.
The following upper limits apply:
- Number of lines: 2 billion.
- File size: 4 GB on 32-bit systems, larger files are possible on 64-bit systems.
-
Memory requirement: The upper threshold is the addressable working memory, but note that the Tracefile Analyzer allocates additional memory for managing the trace structure and line information.
The prompt for partial loading appears if the file cannot be completely mapped into the working memory or if the heuristically determined memory requirement for trace structure and line information is greater than 500 MB.
Availability
2.5 Trace Files During Runtime
If the contents of the trace file have changed in the meantime, e.g. because a trace file is being viewed that is currently being written while the evaluated application is still running, then the menu or the corresponding icon in the toolbar or the F5 key can be used to reload the file and thus refresh its contents.
2.6 IDM Log Files
The Tracefile Analyzer is mainly intended as an analysis tool for IDM trace files and is therefore tailored for them. However, the Tracefile Analyzer also supports the analysis of IDM log files, that is files without trace code lines. The display and color highlighting comply as far as possible with the rules explained in chapter 2.2 . No hierarchy can be determined, which means that the availability of the options for hierarchy navigation (see “Figure 22-2”, chapter 2.1 ) is limited. However, navigation through errors and warnings is possible without restrictions. The usual line-by-line navigation via Arrow up and Arrow down keys is also available.